A weekly routine for instructors
A practical tour of the instructor workspace, organized as a routine: what to check first, where to find each learner's story, and which reports to pull.
On this page
What this guide covers
- What the instructor workspace covers, and what is left to administrators
- A short routine for the start of each week
- Where to find a single learner's progress, quiz results and activity
- The four reports instructors can export, and when each is useful
Your workspace Link to “Your workspace”
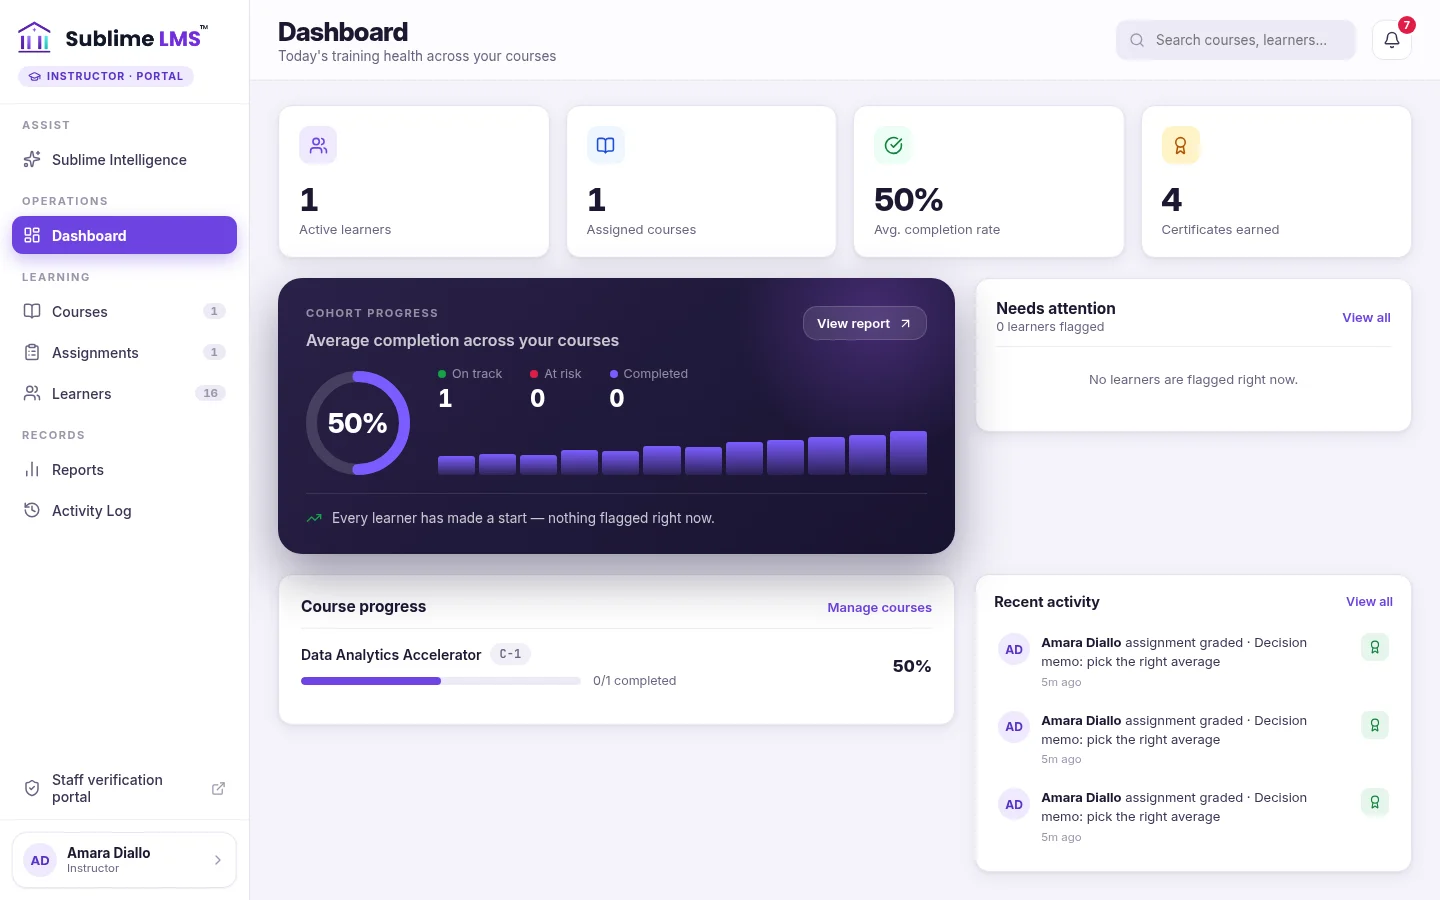
The instructor workspace shows the courses you are assigned to teach, and only those. Its dashboard gives you the state of things at a glance: active learners, assigned courses, average completion rate, certificates earned, learners needing attention, progress for each course and recent activity.
In your courses you can edit modules, lessons, quizzes and assignments, add learners, review work and export reports. If your organization requires approval for changes to live courses, your edits wait for that approval before learners see them.
Related feature: Instructor workspace
Start with what needs attention Link to “Start with what needs attention”
- Check notifications. New submissions are listed with the learner, course and time, late ones are marked, and each has a Review button.
- Clear the review queue. The guide on reviewing and grading assignments walks through the review panel.
- Look at Needs attention on the dashboard, then open the Learners list filtered to At risk.
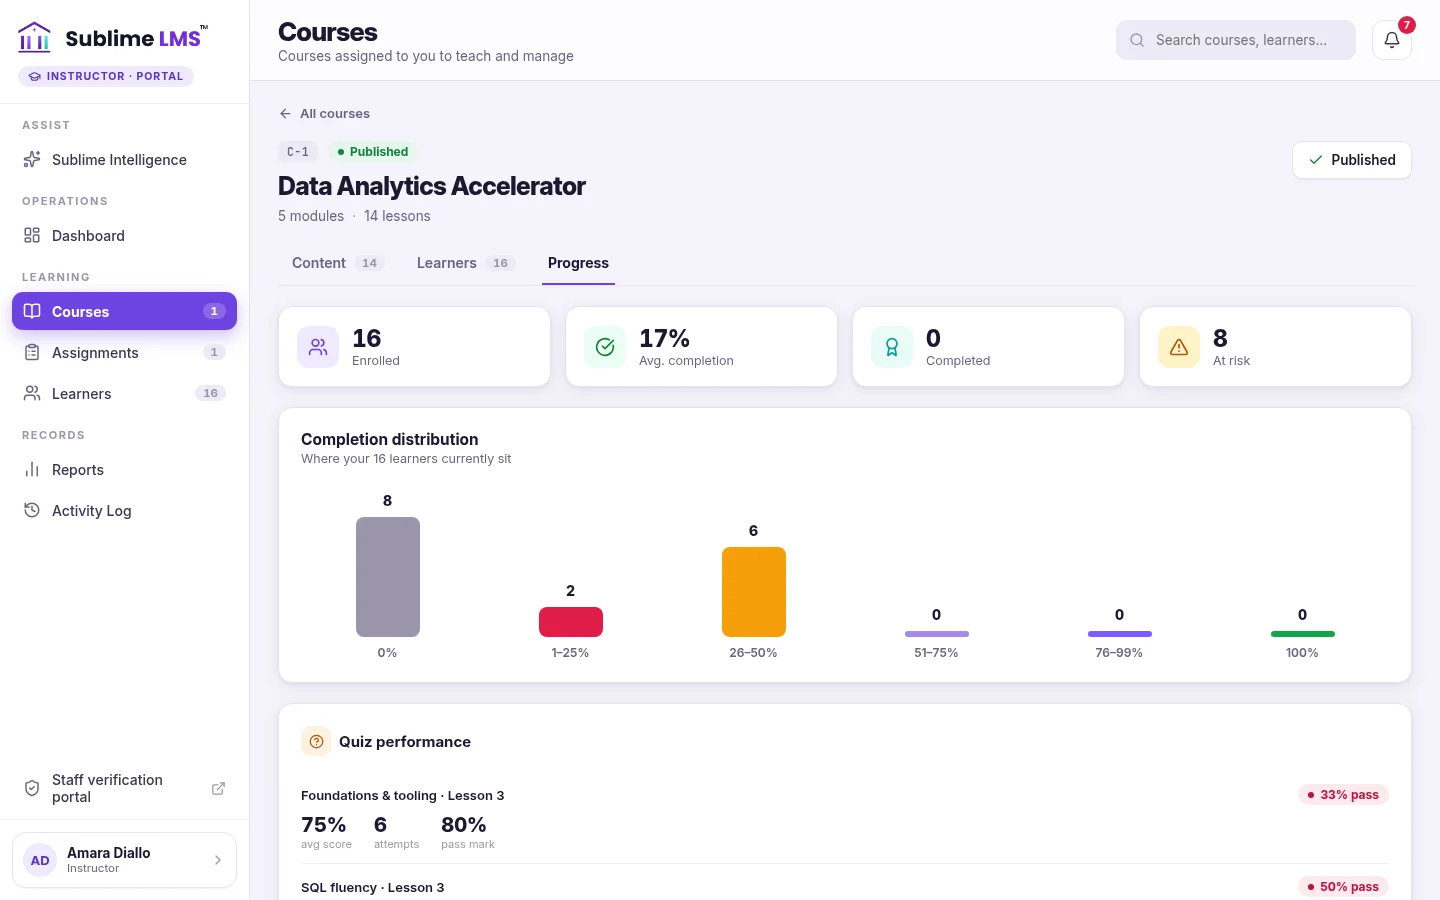
- Open the Progress tab of each course to see how completion is spread, how many learners are at risk and how quizzes are going.
Related feature: Progress tracking
Get a learner's full picture Link to “Get a learner's full picture”
The Learners list can be searched by name or email and filtered by course, status and progress. Statuses are On track, At risk and Completed.
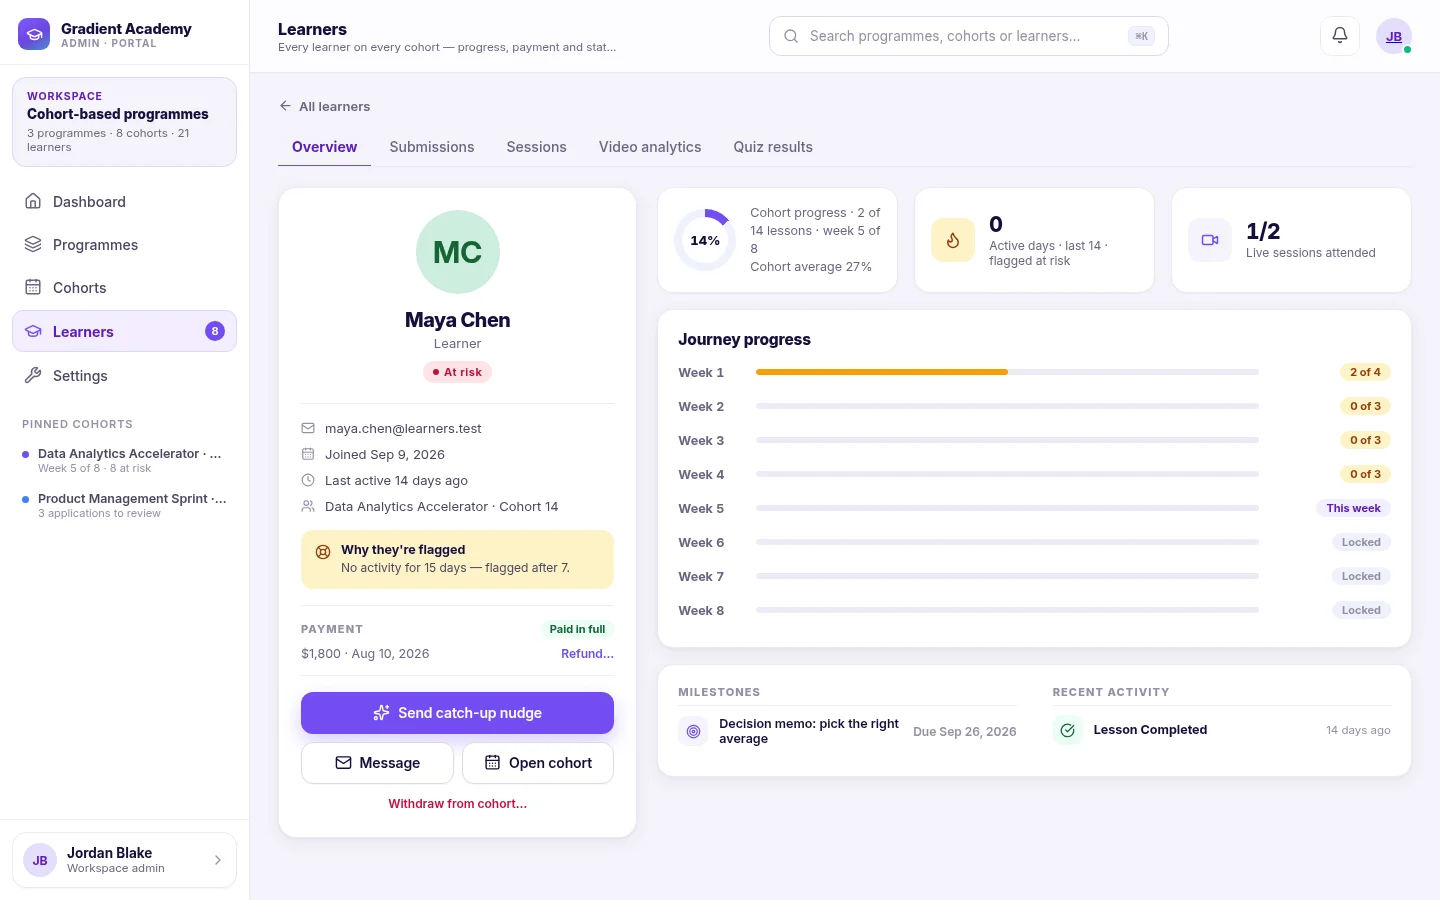
Open a learner to see their courses and progress, quiz results, video analytics and recent activity in one place. It's the fastest way to prepare for a conversation, or to tell whether a low score is a one-off or a pattern.
The Activity Log shows what happened across your courses, filtered by learner, action, course and date.
Related feature: Instructor workspace
Pull the right report Link to “Pull the right report”
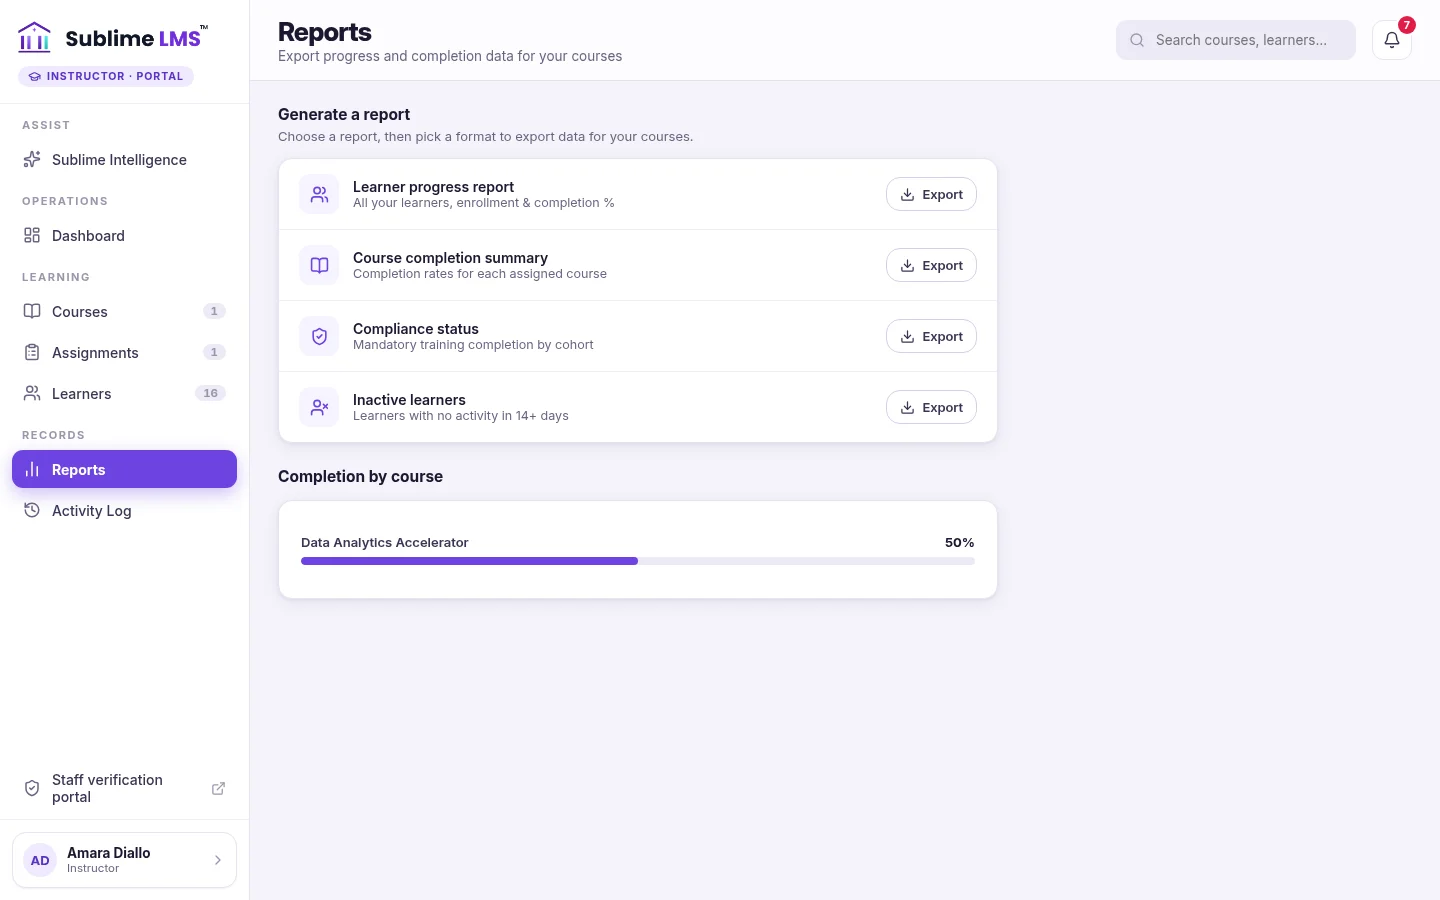
The Reports page exports data for your courses:
- Learner progress report: every learner, their enrollment and completion percentage.
- Course completion summary: completion rates for each assigned course.
- Compliance status: mandatory training completion by cohort.
- Inactive learners: learners with no activity in 14 days or more.
Related feature: Progress tracking
What administrators handle Link to “What administrators handle”
Some actions sit with administrators rather than instructors: creating courses, messaging learners and sending catch-up nudges, running the cohort console, and organization settings such as branding, billing and staff invitations. When you spot a learner who needs a message, pass it on. The Inactive learners report and the learner's page give an administrator everything they need to act.
Related guides
-
 Supporting learners who fall behind
How Sublime LMS decides a learner is at risk, where to see why, who can reach out, and what the learner sees on their way back.
4 min read
7 sections
Supporting learners who fall behind
How Sublime LMS decides a learner is at risk, where to see why, who can reach out, and what the learner sees on their way back.
4 min read
7 sections
-
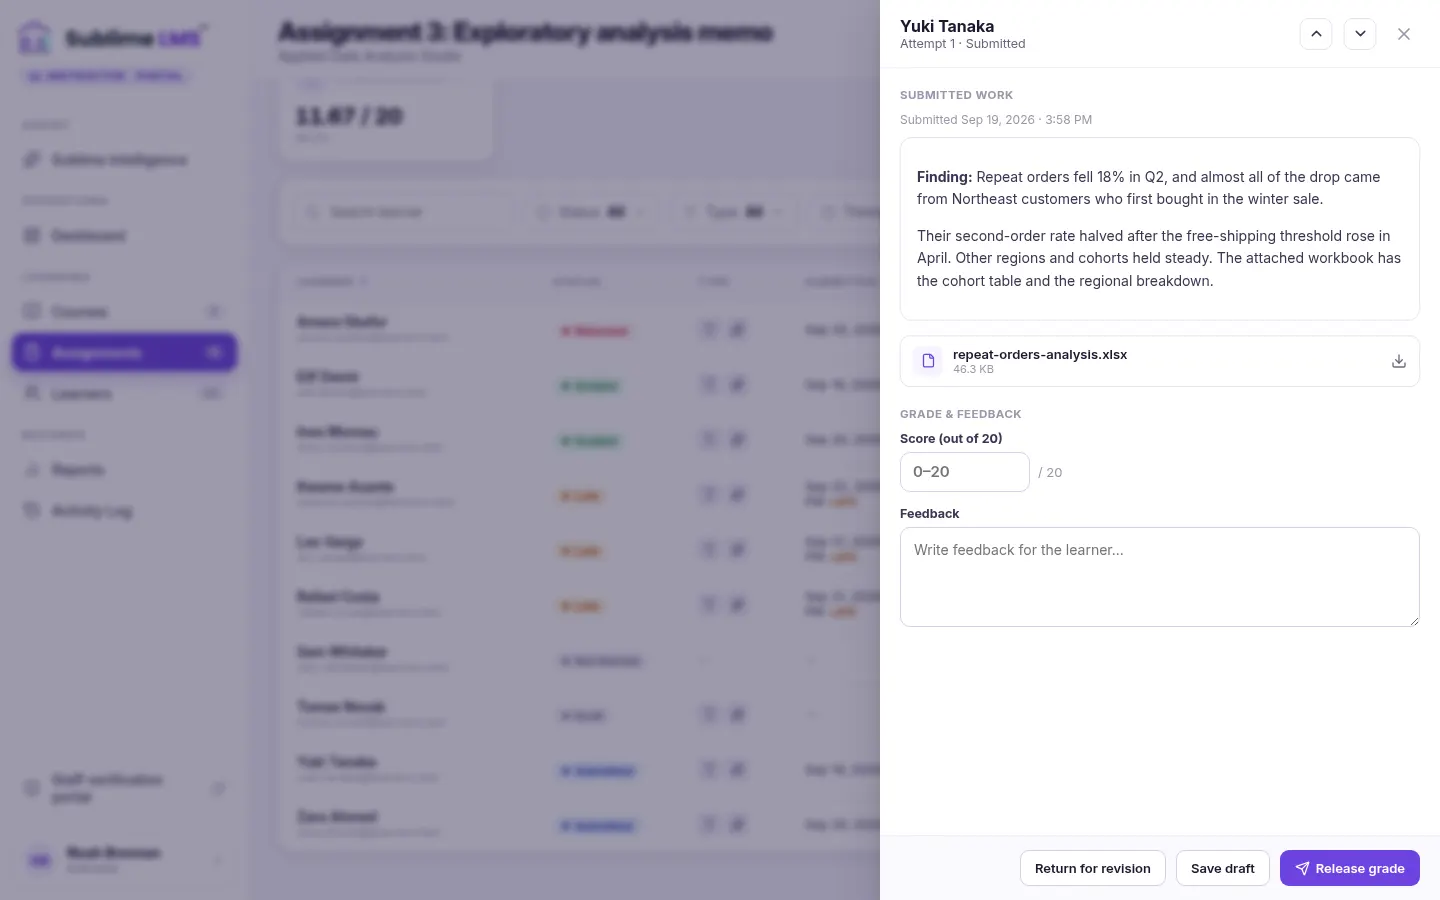 Setting up, reviewing and grading assignments
Configure an assignment learners can't misread, work through submissions quickly, and release grades and feedback in a way that keeps completion accurate.
4 min read
7 sections
Setting up, reviewing and grading assignments
Configure an assignment learners can't misread, work through submissions quickly, and release grades and feedback in a way that keeps completion accurate.
4 min read
7 sections
-
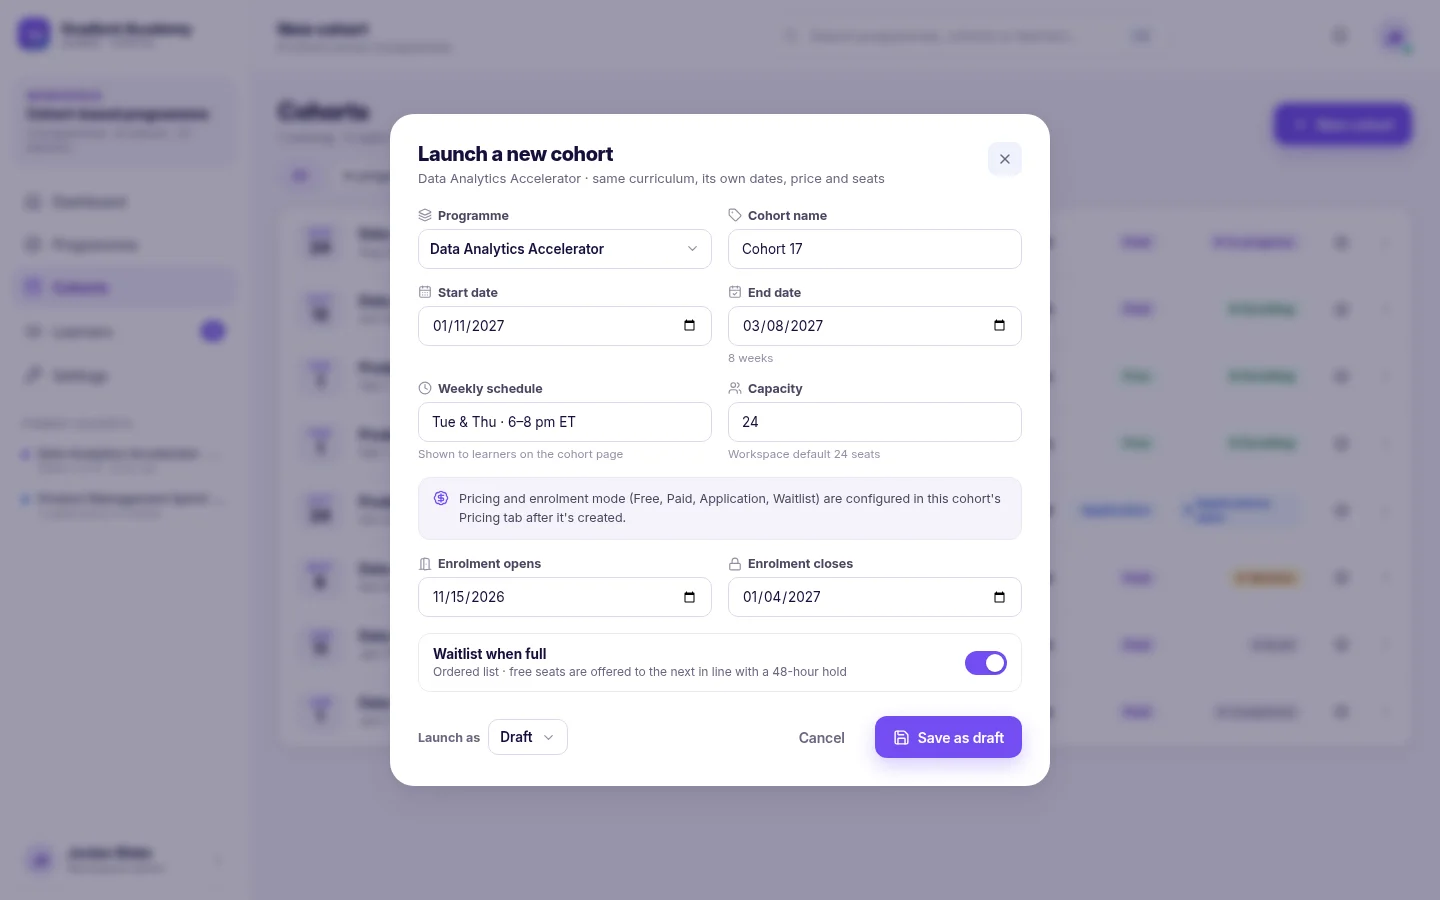 How to launch a cohort program
Take a program from finished content to a running cohort: create the cohort, choose how learners enroll, fill the seats, schedule live sessions and welcome the group.
5 min read
8 sections
How to launch a cohort program
Take a program from finished content to a running cohort: create the cohort, choose how learners enroll, fill the seats, schedule live sessions and welcome the group.
5 min read
8 sections